

API Gateway
The Opstella API Gateway is a high-performance, single entry point for all of your APIs and services, powered by Apache APISIX and natively integrated into the Opstella platform. It centralizes how client applications connect to your backend systems, enforces authentication and access policies, shapes and filters traffic, and feeds every request into Opstella's unified observability — all managed from a single web portal and deployed the same Kubernetes-native way as the rest of Opstella.
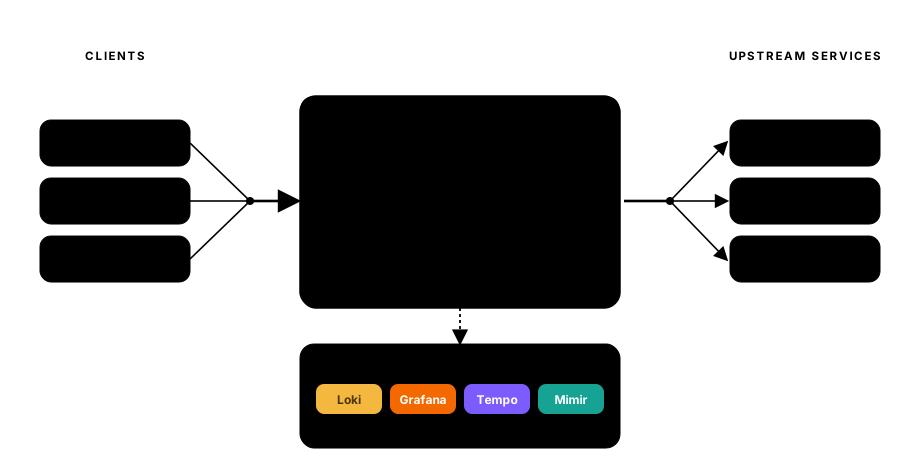
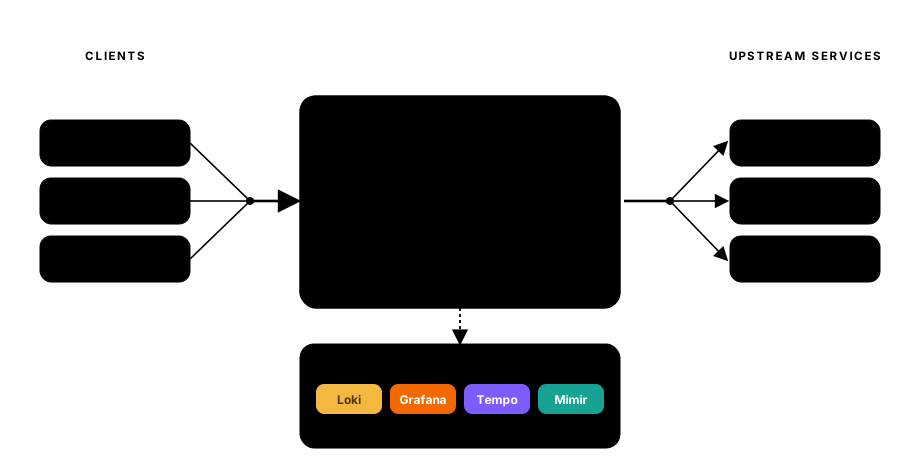
Built on Apache APISIX
Opstella packages, deploys, and operates Apache APISIX for you, and wires its metrics, logs, and traces straight into the Observability dashboard — so the gateway works as a first-class part of your platform from day one.
Key Capabilities
Single Entry Point with High Availability
Opstella exposes all of your services through one secure gateway, so clients integrate with a single, consistent endpoint instead of many scattered backends. The gateway runs as stateless replicas backed by a clustered configuration store, delivering high availability and zero-downtime configuration changes — all manageable from the web portal.
Flexible Authentication
Opstella lets you secure each application with the authentication method that fits it — and apply several methods to the same route at once. The most common standards are supported out of the box:
| Method | Description |
|---|---|
| Basic Authentication | Username and password credentials per client application. |
| API Key | Issue and validate keys passed via header or query parameter. |
| OAuth 2.0 | Token-based authorization, integrating with your identity provider. |
| OpenID Connect (OIDC) | Identity-layer authentication built on OAuth 2.0 (e.g. Keycloak, Azure AD). |
| JWT | JSON Web Tokens with configurable token lifetimes. |
| Mutual TLS (mTLS) | Certificate-level client identity for the highest assurance. |
Access Control and Request Filtering
Opstella lets you decide exactly who can reach each API. It supports IP allow and deny lists, validation of the request origin by IP address, domain name, and HTTP referrer, and consumer-level access rules so every client only sees the resources it is permitted to use.
Rate Limiting and Traffic Control
Opstella protects upstream services by capping how often each client application can call an API within a given time window. Limits can be applied per consumer, per route, or globally, keeping usage fair and backends healthy under load.
Resilience: Circuit Breaking and Retries
Opstella keeps services stable when things go wrong. It can trip a circuit breaker when an upstream starts failing and automatically retry transient errors, shielding clients from intermittent issues and giving backends room to recover.
Response Caching and Invalidation
Opstella can cache frequently requested responses at the gateway to reduce load on upstream services and improve latency. Caching is configurable per API and endpoint — including time-to-live (TTL), which request methods are cacheable (for example, GET only), and which response codes to cache. Cached entries can be invalidated by time and on other conditions — for example, when the upstream data is updated — so clients are never served stale content after the source changes.
Secure Communication and Certificate Management
All traffic is served over TLS 1.2 or higher. Certificates — including those used for mTLS — are uploaded and managed directly from the web portal, and Opstella's observability stack can alert you before a certificate expires so renewals never catch you by surprise.
Unified Observability
Every request flowing through the gateway is captured by Opstella's observability stack. Metrics are exported in Prometheus format and stored in Mimir for long-term analysis, structured logs are collected and made searchable in Loki, and distributed traces are captured in Tempo — giving you real-time insight into latency, error rates, and request volume for every service and route.
Dashboards, Reporting, and Alerting
Opstella provides interactive, fully customizable Grafana dashboards covering API success and failure rates, usage volume, performance, and business analytics such as your most-used APIs and most active consumers. Data is retained for long-term reporting and can be exported in standard formats such as CSV and JSON through REST APIs. You can configure threshold-based alerts — delivered by email, webhook, and other channels with priority levels and routing — for conditions such as high error rates, slow response times, or an unreachable service.
Elastic Scaling and Flexible Deployment
Because the gateway is stateless and containerized, Opstella scales it horizontally to match demand, with Kubernetes auto-scaling adjusting capacity automatically as traffic grows. It can be deployed fully on-premise, alongside the rest of your Opstella environment.
Client, API, and User Management
Opstella lets you add, update, and remove client applications and create an unlimited number of APIs, services, routes, and consumers — all from the web portal. Each client application can be given a validity period: credentials such as API keys, tokens, and certificates carry configurable expiration dates, so partner access ends automatically on schedule instead of lingering after a contract lapses. Platform users are managed centrally through Opstella's single sign-on and role-based access control, with roles such as Administrator and User.
Standards & Compliance
The API Gateway is designed to help teams meet the security, operational, and governance expectations of an enterprise-grade API management layer. The table below maps common requirement areas to the capabilities described on this page.
| Requirement area | How the Opstella API Gateway addresses it |
|---|---|
| Transport security | TLS 1.2 / 1.3 only, with configurable cipher suites and per-SNI certificates managed from the web portal. |
| Authentication | Basic, API Key, OAuth 2.0, OIDC, JWT (with token lifetimes), and mTLS — combinable on a single route. |
| Access governance | IP allow/deny lists, request-origin validation by IP, domain, and HTTP referrer, and per-consumer authorization. |
| Rate & abuse protection | Per-consumer rate limiting, circuit breaking, and retries to protect upstream services. |
| Logging & audit | Structured request logs collected in Loki, searchable and retained for long-term audit (e.g. 90 days or more), with archival to centralized object storage. |
| Monitoring & metrics | Prometheus-format metrics stored in Mimir, with real-time latency, error-rate, and request-volume tracking per service and route. |
| Alerting | Threshold-based alerts for high error rates, slow responses, or unavailability, delivered via email, webhook, and other channels with priority routing. |
| Reporting & export | Interactive Grafana dashboards, with usage data exportable as CSV and JSON through REST APIs. |
| Resilience & availability | Stateless, horizontally scalable replicas with Kubernetes auto-scaling and a clustered configuration store for high availability. |
| Portability & licensing | Open-source foundation (Apache APISIX), deployable on-premise in containers, with no per-request or per-object licensing limits. |
INFO
Retention periods, alert thresholds, and auto-scaling policies are configurable to match your organization's standards and are set during deployment.